使用 grafana-alloy 监控盒子数据
背景
最近入了 PT 的坑,买了一个盒子刷流,但是总是有事没事登录上去看看上传速度,还挺浪费时间的,于是打算自动监控相关的上传数据。
一说到监控,我都会使用 grafana + prometheus + alertmanager 搭建监控系统,prometheus 是整个系统的核心,它会定期拉取监控数据,并将数据存储在自己的数据库中。配合 grafana 可以实现数据的可视化展示。最后通过 alertmanager 配置告警规则,实现告警功能。
但是 prometheus 需要拉取数据源的前提是 promethues 能访问到数据源,但有些情况我们不能或者不希望暴露这个数据源,原因比如:
- 数据源位于 nat 内网,没有对外 IP
- 就算有外网 IP,也不希望直接用 ip,而是 http + tls 访问
- 然后 tls 证书又是自签名的,不被 prom[[20250603-0303]]etheus 信任
- 就算有了 tls 证书,也不希望对任何人公开,所以还要加上认证 (basic-auth)
总之,一顿操作下来原本很简单的数据收集变成了麻烦事,promethues 采用拉取数据前提一定是两者都位于相互信任的网络环境。
这个时候让数据源主动推送数据给 prometheus 就是一个比较好的选择。
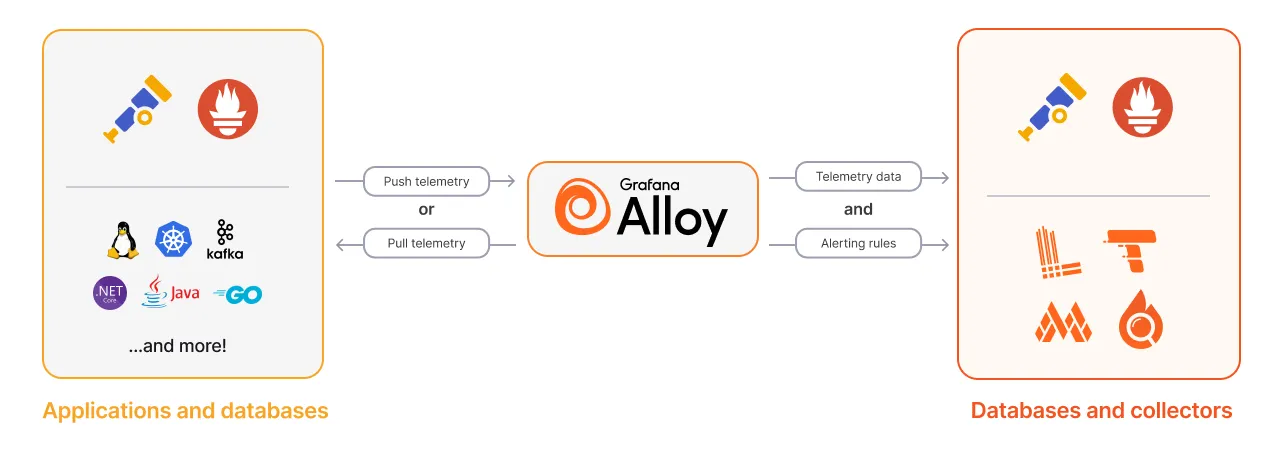
一开始使用的主动推送的工具是 grafana-agent, 现在更推荐 grafana-alloy,具体原因参考From Agent to Alloy: Why we transitioned to the Alloy collector and why you should, too
grafana-alloy 如何工作呢,简单来说就是运行一个服务,它会定期拉取数据源的数据 (/metrics),然后将收集的数据再主动推送给 prometheus。
具体的例子
入门安装相关的文档参考官网, 这里直接进入实操。
因为提供的盒子没有权限安装软件,所以我的做法是本地起一个定时拉取 qbitorrent 数据的服务,然后通过 alloy 把抓取的数据推送给 prometheus。 这个定时拉取的工具是 prometheus-qbittorrent-exporter
你要有一个公网能访问的 prometheus, 不想自己搭建可以试试官方 grafana cloud,提供的免费额度也够用了。
下面的例子假设使用了官方 grafana cloud, 后面有机会自己搭建了在更新文档把。
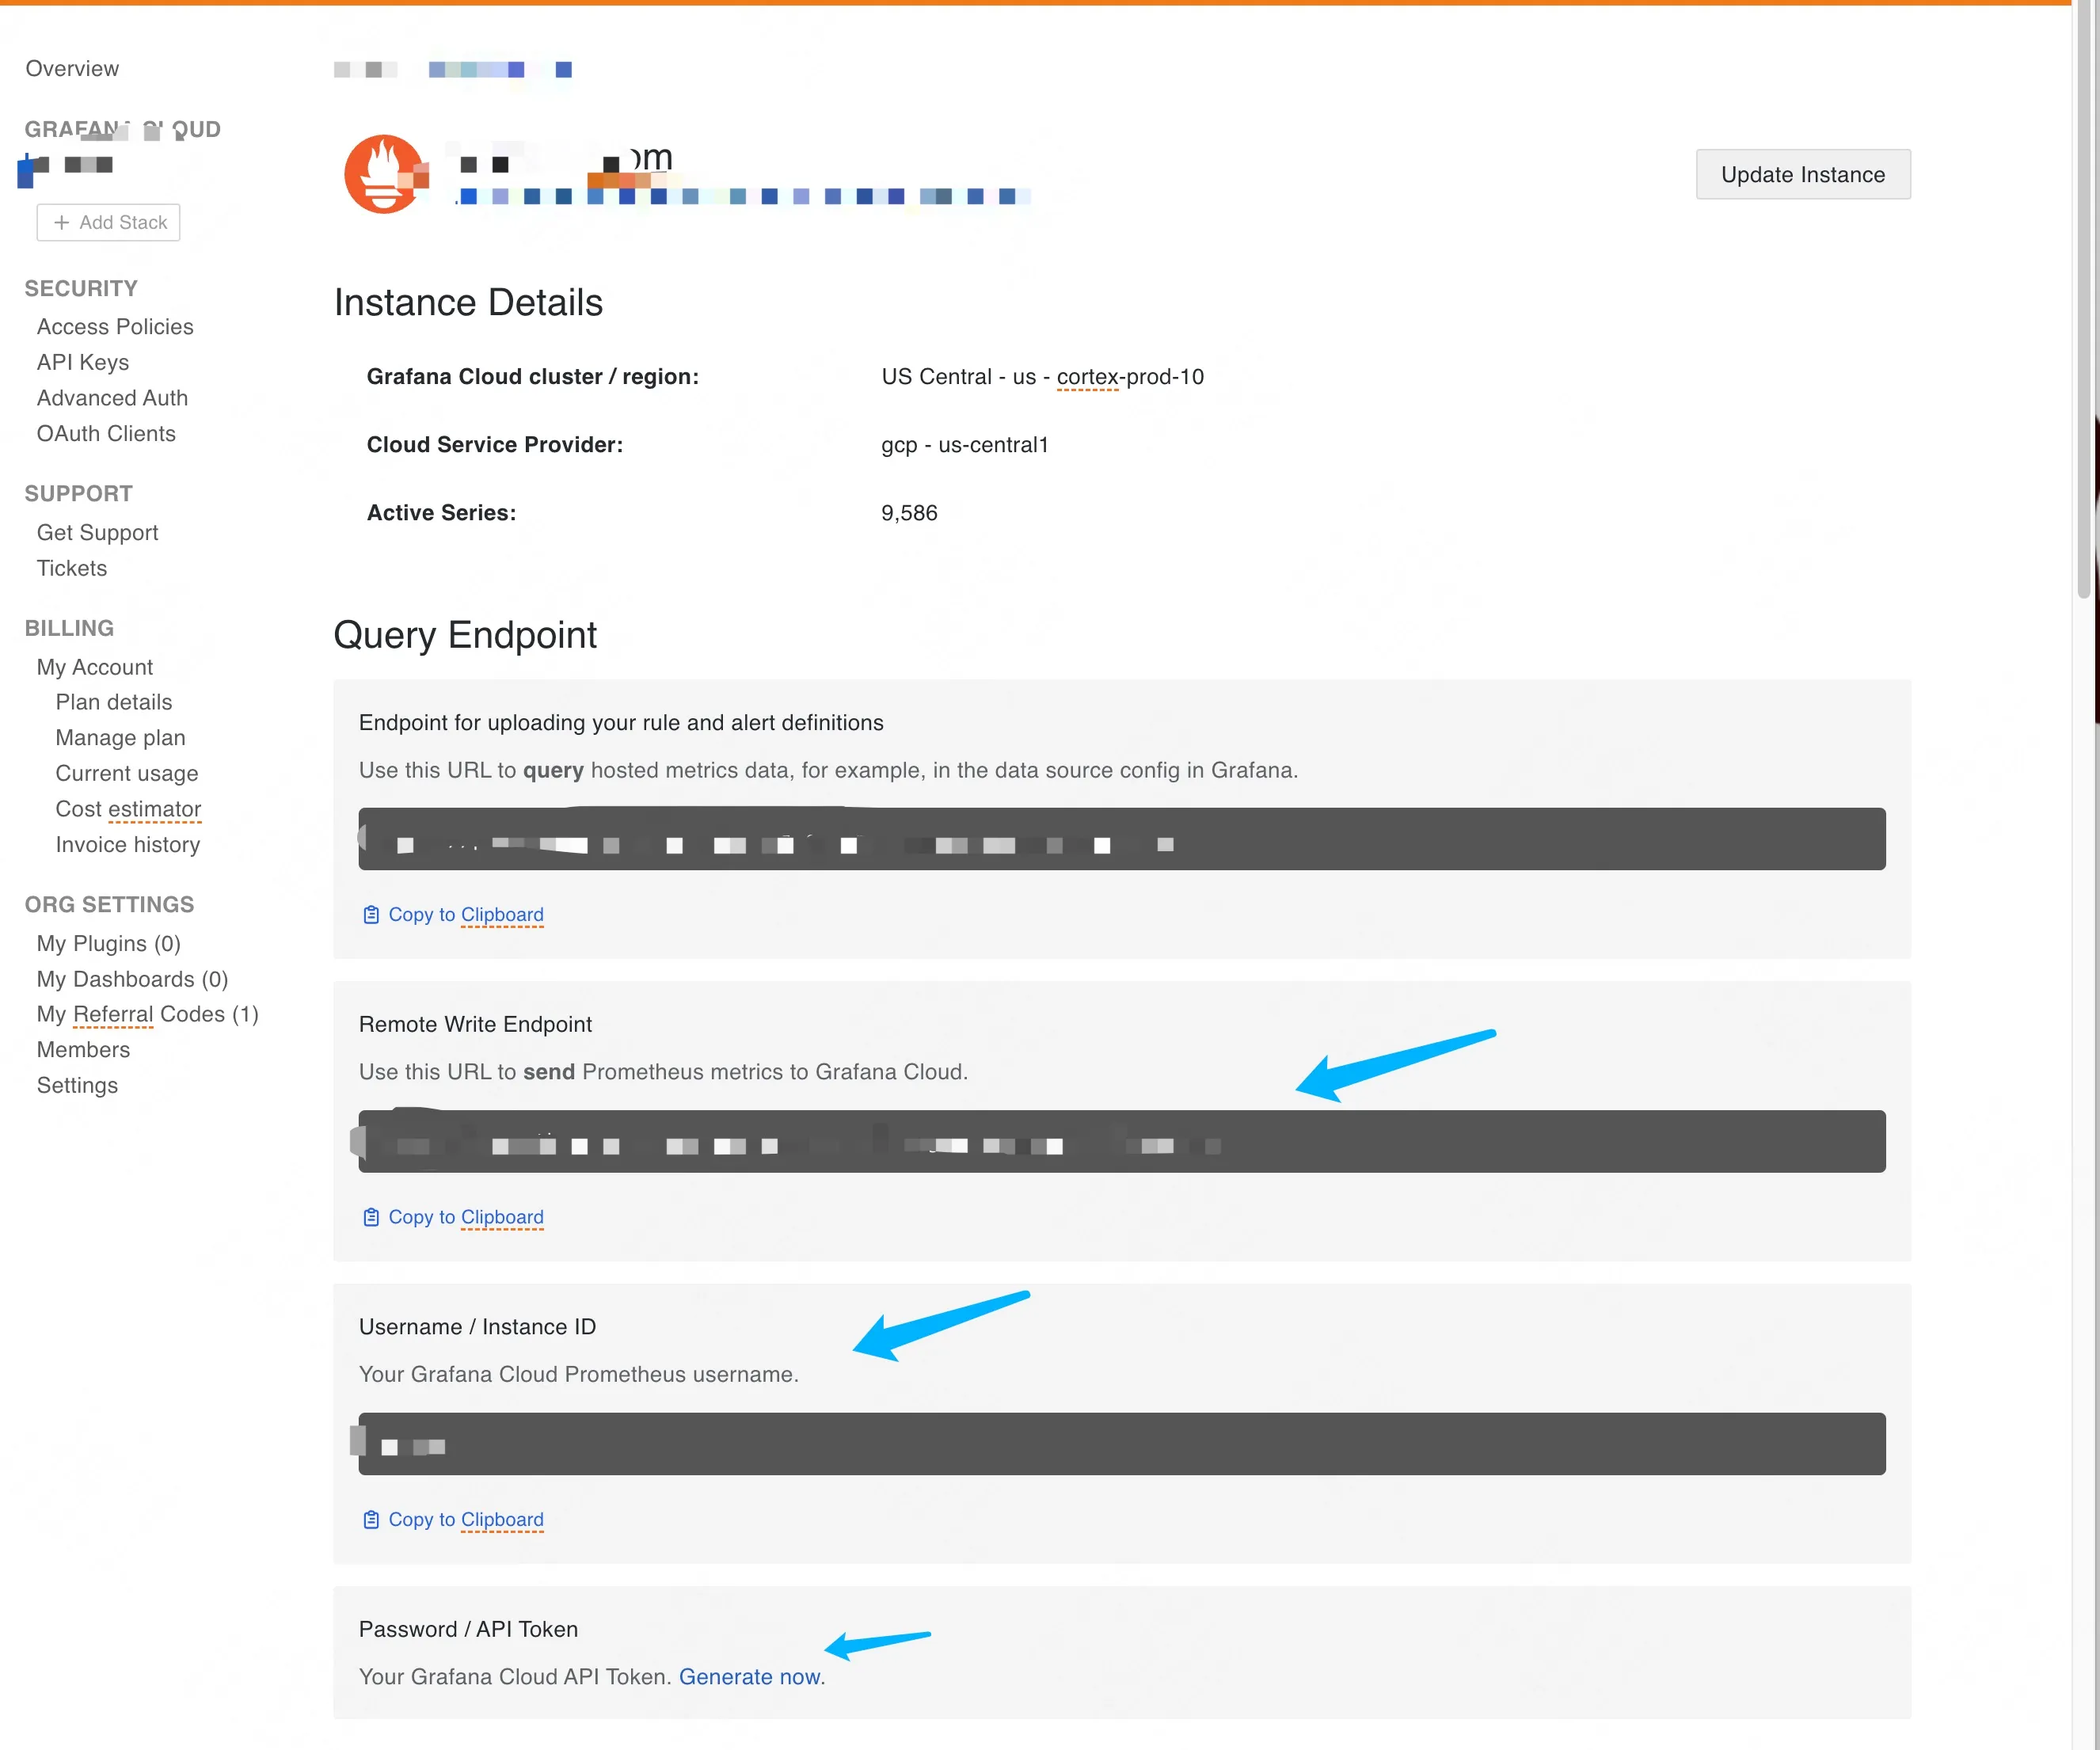
首先你需要获得自己 promethues 的地址和 key, 具体就是进入后台,查看 prometheus 的详情页面。
把下面箭头的三个数据复制下来,api token 没有的创建一个。
项目的目录结构:
.├── config│ └── config.alloy└── docker-compose.yamlversion: '3'services: prometheus-qbittorrent-exporter: image: ghcr.io/esanchezm/prometheus-qbittorrent-exporter environment: - QBITTORRENT_HOST=盒子host地址 - QBITTORRENT_PORT=443 - QBITTORRENT_USER=qb用户名 - QBITTORRENT_PASS=qb密码 - QBITTORRENT_SSL=true - QBITTORRENT_URL_BASE=盒子地址后缀(开始不带/) - EXPORTER_PORT=10000 ports: - 10000:10000 alloy: image: grafana/alloy:latest command: run --server.http.listen-addr=0.0.0.0:12345 --storage.path=/var/lib/alloy/data /etc/alloy/config.alloy volumes: - ./config/config.alloy:/etc/alloy/config.alloy ports: - 12345:12345// For a full configuration reference, see https://grafana.com/docs/alloylogging { level = "info"}
prometheus.exporter.unix "default" { include_exporter_metrics = true disable_collectors = ["mdadm"]}
prometheus.remote_write "grafanacloud" { endpoint { url = "第一个箭头的数据"
basic_auth { username = "第二个箭头的数据 password = "第三个箭头的数据 } }}
prometheus.scrape "default" { targets = concat( prometheus.exporter.unix.default.targets, [ { job = "qbitorrent-exporter", __address__ = "prometheus-qbittorrent-exporter:10000", }, ], )
forward_to = [prometheus.remote_write.grafanacloud.receiver]}docker compuse up -d 起来没问题就行了。
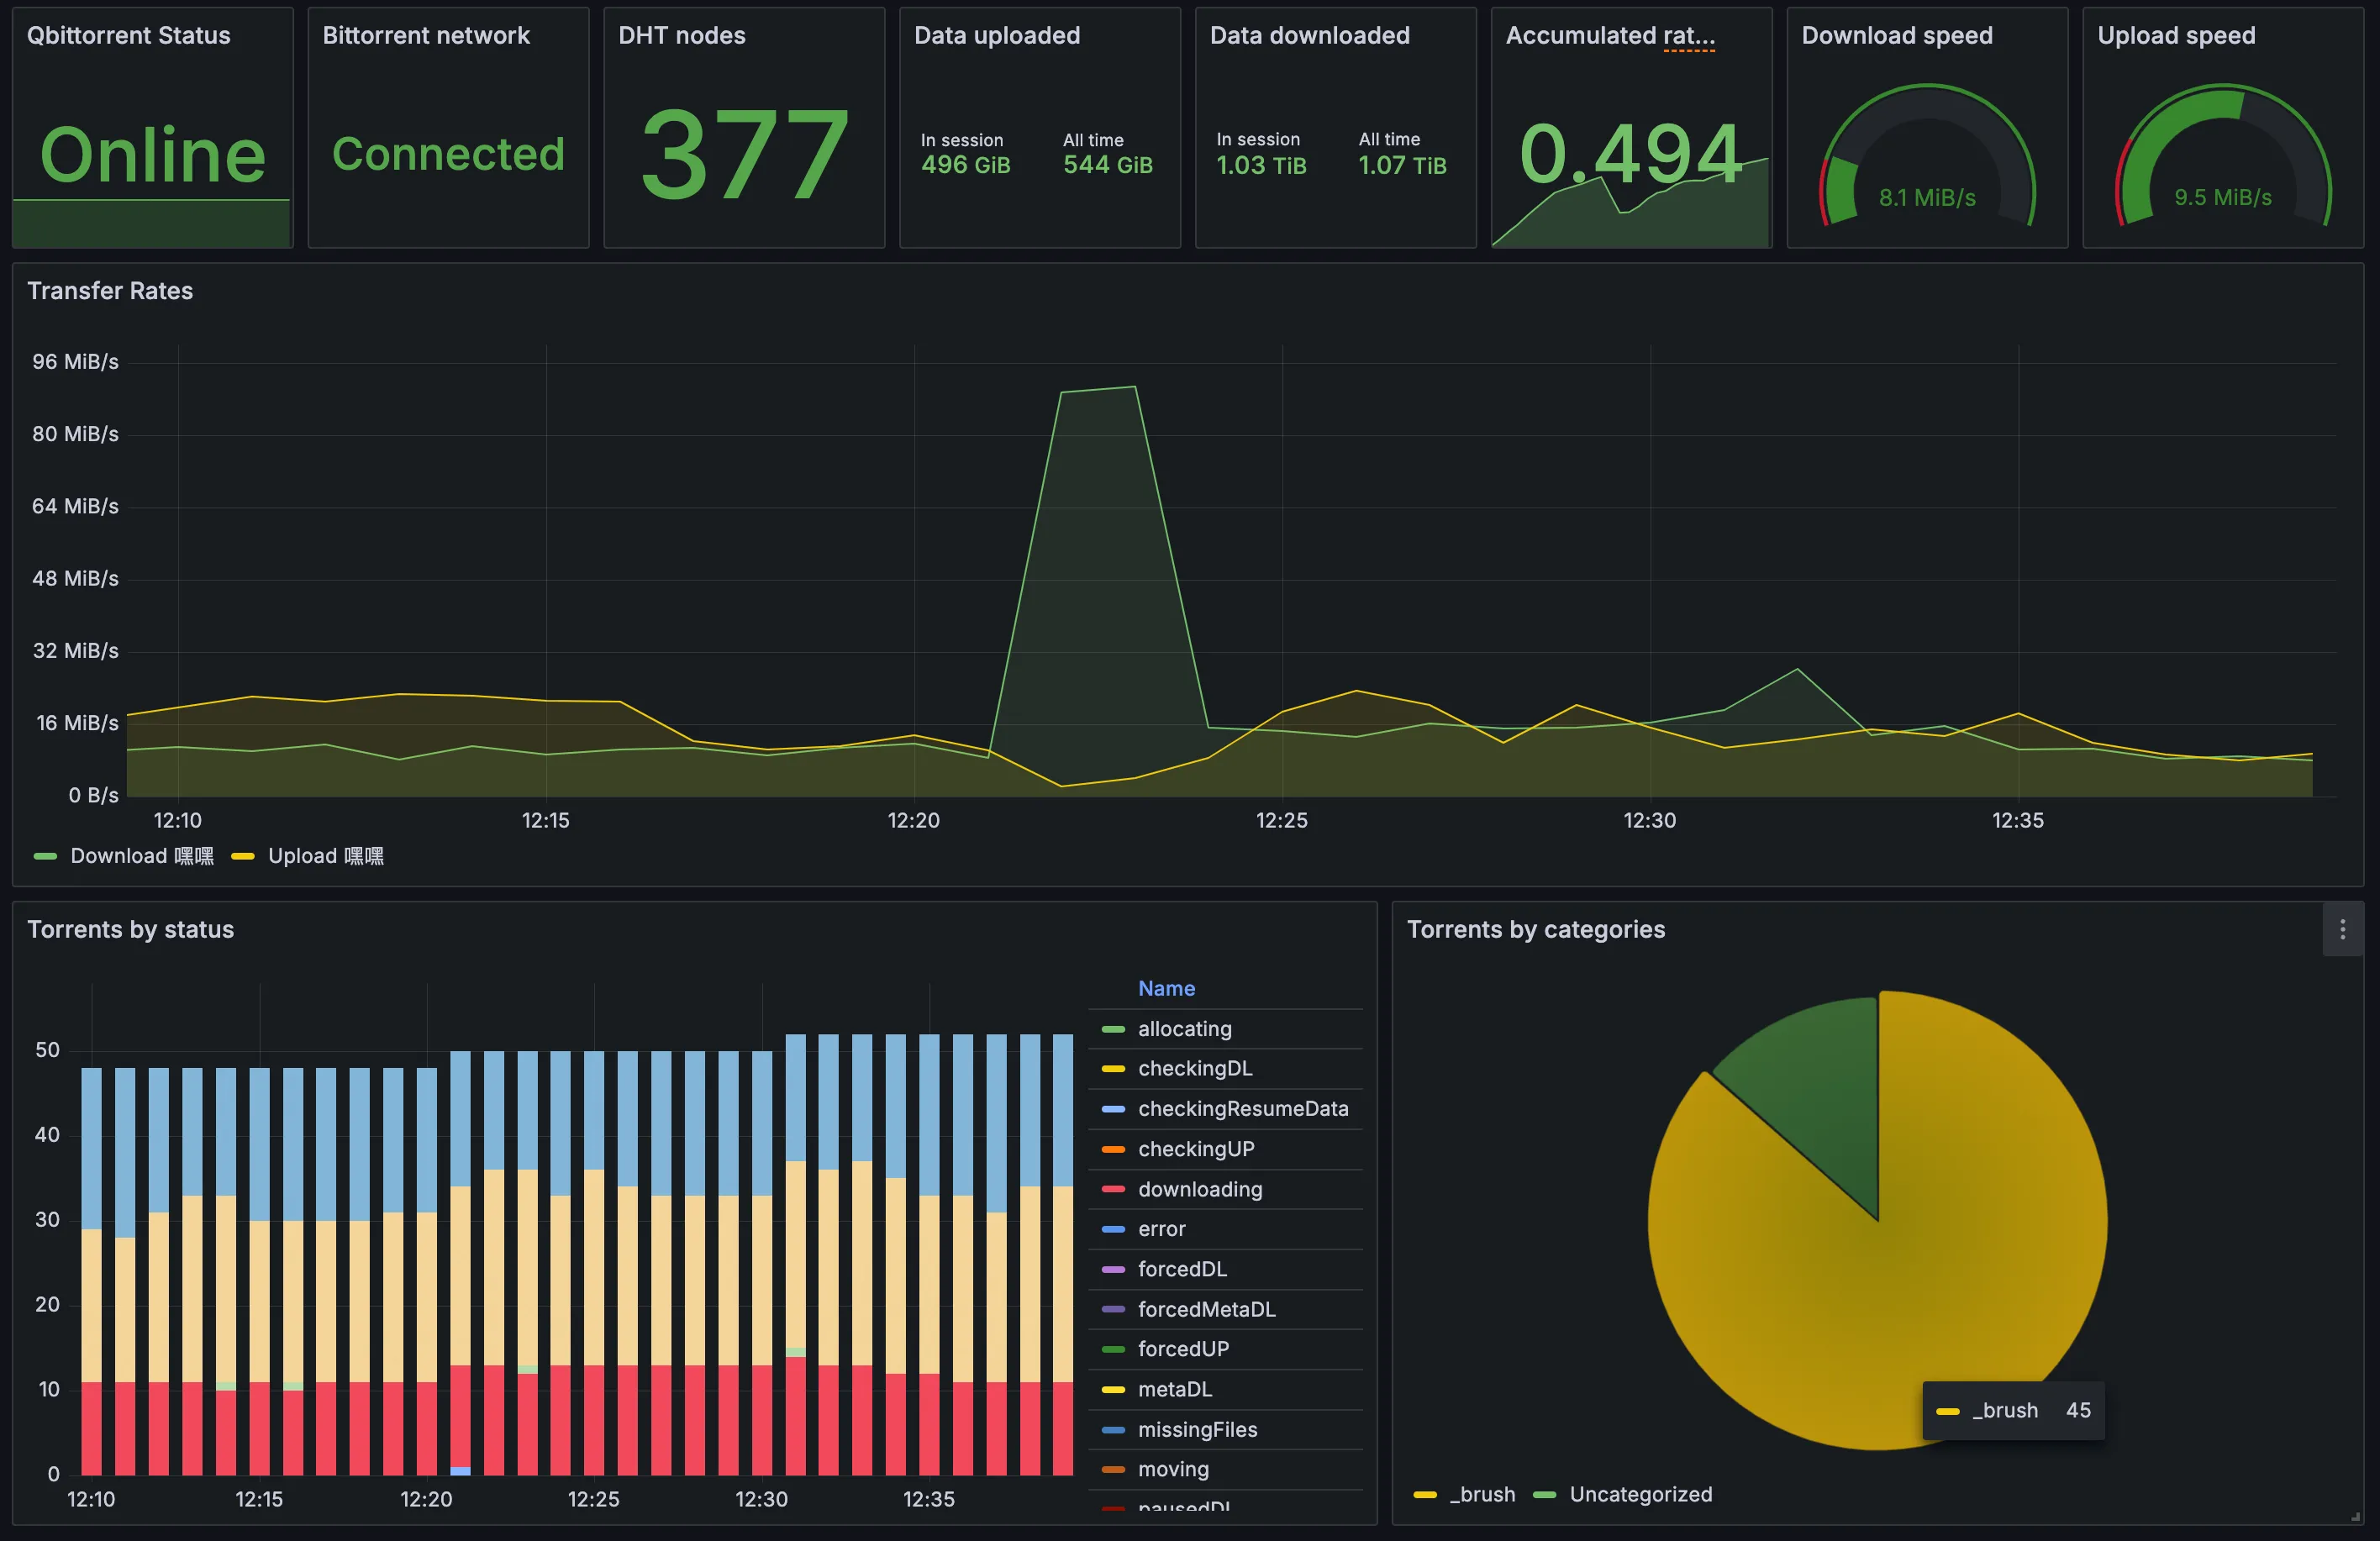
最后通过作者提供的 dashboard 配置 就能看到炫酷的下载数据了。